

Free Zone
Enter The Virtual Trading Floor - Here is a video tour
The path to a successful trading career begins with learning the basics. Our site is here to help you with that. Here are some of the features we offer new and experienced traders and investors.
Check back here regularly to find out what's going on at the trading floor. We will update this page with analysis and tickets to entry the virtual trading floor.
Our Platforms
Find out what is going on in the world of global markets and international trading.
Visit our pages:


Join The Full Member Zone
Find the best plan for you
Online Video Course
£1200
Perfect for new traders
Course includes:
24/7 access to online training modules and videos - 300+ page training manuals.
Personal platform to learn how to trade
Have all of the tools at your disposal.
Learn and earn around in your own time.
Most of all lessons on how to become a independent trader.
- BEGINNER SECTION - 9 Lessons
- INTERMEDIATE SECTION - 13 Lessons
- INDEPENDENT TRADER SECTION - 6 Lessons
- EXPERT SECTION - 4 Lessons
- ADVANCED COLLEGE SECTION - 3 Lessons
- UNIVERSITY PHD SECTION - 4 Lessons
Pay by Instalment -£500 then £70/month
Standard
£99/mo
Perfect for growing traders
Membership includes:
24/7 access to online training modules - 200+ page training manuals.
5 Free Training Videos
Membership to the community of over 150 traders
Weekly recorded webinars posted in the full member zone
Access to our trademark "request a pair option"
Most of all lessons on how to become a independent trader.
Regular market updates
Annual Saver - 58% off
£499
Perfect for saving
Membership includes:
Everything in the standard plan
12 Months Access to the signal group.
Save 58% off the full membership & have all of the tools at your disposal.
Learn and earn around in your own time.
[ Most popular ]
Premium 1-2-1 Coaching
£50/ 1 Hour session
Perfect for extra confidence
We can host 121 sessions around your availability.
Online Webinar - £50/h , this includes a 1 hour webinar training session with screen share and a video recording sent to you to keep an inventory of your learning sessions, all you need is a PC & wifi. [ Best value]
Recent Blog Posts

In this weeks live session and video recording we will be covering the watchlist for the trading week. We will discuss what we feel is next on the cards for a few currency pairs, key levels to look out for and we will explain how the full member zone works Trading Topics: Trendline Zones & Key Levels Trade Entries Specifically GBPUSD- EURUSD - NZDCAD - & you will get our setups of an pencilled entries with further scope for live market executions. Book Your Sear Here: Copyright © All Rights Reserved. RISK DISCLOSURE STATEMENT: The services and content that Armchair Trading Floor provides is for educationa and research purposes only. Risk Notice: Foreign Exchange and CFD trading carries a high degree of risk and is not be suitable for everyone. Trading is not guaranteed to make you money, only invest what you can afford to put at risk as there is a possibility you could incur losses. THE USE OF LEVERAGE CAN LEAD TO LARGE LOSSES AS WELL AS RETURNS. PAST RESULTS ARE NOT INDICATIVE OF FUTURE RESULTS. PLEASE READ CAREFULLY THE FULL DISCLAIMER.

Welcome back to another trading week in the armchair trading floor guys.. This week, I’m revisiting my analysis of the pound pairs.. we expected bulls to come back in after the last manipulated deadline date of the 31st October ( prior brexit date). I had a feeling that the date was going to get pushed back since June as the technicals weren’t showing too much upside, coupled with our analysis of the bottom prices at the beginning of October it seemed we will take a corrective low before a long term wave to the upside. At the begging of the week, I presented the first risk reward profile for an 88 pip move with a 33 pip SL.. all I used for the entry was a key level screening on the higher timeframe. The fact that we rejected of this 1.8650 level was the first step in building a case for this trading setup. As always, we expected a retest of our entry ( Angel round opportunity) to be there, so once this is completed we will look for additional positions to scale into this trade. A successful break of the minor resistance level set for our second entry looks good and gave the 2nd bullish confirmation. Notice a retest of the key 1.8650 level! Expecting a revisit to the recent highs of mid October , an simple trendline on the correction was detailed with the 3rd hedge being a breakout of the trendline drawn below. You can see how I’ve scales into this trendline break with some flexibility of price pushes lower we can exit at break even... the stop loss placement will change and be set at 1.8650 if the break is achieved. It is still early days. Here is my MT4 setup , on the image I have moving average indicators set to show the smoothened price action flow. 1.8722 is the next resistance area that needs to be taken out, I expect once we get to this level we shall forcast a bullish corrective pattern like a flag or pennant. This is a flag pattern, Look for price to replicate on the H4 timeframe This is a pennant, Look for the candlesticks to form on H4 timeframe 9.11.10 The analysis blew out just before Fridays close , we weren’t able to sustain the support on the key level 1.8650 .. the reality is that the 2nd and 3rd entries were too presumtuous. I will look to revisit this trade once we close on a daily time frame above 1.8650

Expected 80 to 100 pip correction on market open USDCAD has been a popular instrument that has faces many short sellers entering into text book sell positions over the past few weeks. The price has met its support from previous impulsive lows and lower lows formed in the more recent downtrend. Like anything the market needs to form a natural correction before any further move to the downsides the DXY has also recently had a rejection off its wedge resistance which will contribute to most dollar pairs falling. [insert DXY PIC] As USDCAD closed last weeks trading session under the 200 MA , we expect a natural correction to retest this level of 1.3218 .. this is where many short sellers took entries over the past 2 weeks. With an initial entry at 1.3128 we have a risk profit of 1:58 risk to reward and a tight 16 pip SL which makes a worth while trading setup. We can also highlight a small resistance in the minor ranging price levels between 1.3130 - 1.3146 resistance. Subject to a successful break of 1.3146 I will look for a breakout opportunity as suggested on the image above with similar risk to reward. Only once retested and we have broken the new high formed to confirm a more north will I then update notes and look for a SL placement. 23.10.19 Stop loss hit !!! 24.10.19 I’ve revisited an entry opportunity for a correction. On the higher timeframe we are at the trendline which we expect to break, following the stop hunt from the beginning of the week we seek some support at the 1.3060 level. So it warrants an additional entry with the same stop loss length to target clawing back the lost risk. I see 1.3120 as minor resistance and we are hoping for the price to push up off the moving average once we have taken out this level, more than likely a +40 pip H4 Candle . RESULT: We have achieved the 115 pip target ! 🍀
We have a potential completed pattern for GBP pairs. Going into the week ahead, on market open we could possibly see a retracement immediately on market open as we’ve closed on the resistance zone of the daily timeframe + on the trendline resistance of the parallel channel. 1. Our attention begins with the double bottom reversal pattern from August . As you can remember we called the extreme lows of GBPJPY in the full member zone, you can use this link to see the result from our social media post too. To view click link below: https://www.instagram.com/p/B2KbC8Bgrs8/?igshid=1azrgahflyqi1 Double bottom - we can identify a trendline resistance from the top trendline being EXTENDED, this will remain important. 2. we have applied the 12345 Elliot wave impulse tool on the tool by using the confirmation of the double bottom. The key indicator from the rules of the Elliot wave for wave 1 to 2 is to ensure that the price doesn’t retrace lower than the previous low or stays below 100% retracement. The next level of resistance ( previous extended trendline + the typical target level for the double bottom) was an obvious take profit level for wave 2 to 3 which is usually the largest range. Ensuring that you understand the rules for the impulse waves will help to recognise certain take profit zones & potential areas to move SL . The rules of the Elliot impulse waves states that wave 1&4 shouldn’t cross areas. An additional confirmation of this is to use the Fibonacci retracement tool from wave 2 to 3, and notice how the favoured 61.8% level is inline with wave 4. This should help with setting take profit and SL targets with the D1 & D2 targets. If the 61.8 level was missed , then the activated buy zone would have been at a breakout of the range . Notice how the d2 target is in line with wave 5. We were able to set wave 5s target Because the rule of the Elliot wave impulse principle is that the distance between wave 2 to 3 should be the same distance between 4 to 5. Inspiration Links & References * Armchair Trading Floor Full Member Zone * Elliot wave PDF * Fibonacci PDF * Armchair 2.0 Course

Module 2 So now that we understand that we have set a long term target of sensitivity at the previous top of the market, we need to take a view on how to set a risk profile for entering the market and breaking down a budget. Doing so will enable us to decide on risk to reward levels and setting our failed levels where we will exit the investment with a minimal drawdown and we can also set further levels where we can accumulate further positions and top up our investment portfolio. Photos with examples 1. Bitcoin: current price 7964 - targeting 20,000. On this example , by owning digital shares in this you will buy a cash price of a share and watch the valuation fluctuate over time. Let’s look at 2 year price plan based on 2 purchases. Purchase 1- December 2019 : Buy £1000 worth of shares at 8000 market price. Purchase 2 - February 2019 : Buy £500 worth of shares at 10000 market price. Your portfolio has an initial £1500 cash injection, however because purchase 1 was completed at a lower price and by February when purchase 2 was made, by the time purchase 2 is done then the portfolio is worth £1750. So a 25% increase purchase 1. Assuming that by 2021, the prices have returned to the highs and achieved the target, Purchase 1 is worth £2500 (+150%) & Purchase 2 is worth £1000 (+100%) Total portfolio value: £3500 Stop loss : So on the flip side of making money, if the price falls the other way then your portfolio value decreases. Setting a stop loss or exit level is a smart thing to do and facing the possibilities of having risk is more powerful than the reward. A drawdown level of 40% is a suitable Stop loss level at the current prices due to them being so low and our assumptions of the market finally turning. Using the examples below , based upon a 40% drawdown .. your time to exit the investment sits at when the price is 4800. This is what the risk: reward profiles look like on a chart. ( risk = red / reward = green) Any investment at 1:3 risk reward is worth taking , this is sat at 1:4 so offered a juicier proposal whilst leaving wiggle room and space to feel comfortable if the price draws down. Next, the example above shows the worst profile based upon our selected instruments in the investment plan. Using the others as examples, let’s go over the targets, risk reward and monetary levels. 2. XRPUSD The price is current trading at 0.28, as indicated earlier we are targeting 2.80. Target This shows an upside target of +1000% ( x10). Using a monetary example of £1000 if you purchased £1000 shares of XRP at 0.28 and the end target of 2.80 is met over the next few years the this purchase would be worth £10000. 1:19 Risk reward profile Stop loss The stop loss placement on this example sitting at 40% drawdown or loss is at 0.16 , it would be extremely unlikely based upon current lows and the price action for the price to reach these levels based upon market shape. Using the £1000 monetary example a 40% loss would equate to the £1000 injection being valued at £600. 3.ETHUSD This digital currency offers a 1:15 risk profile . Using the £1000 example , to purchase a share in ETH and achieve the target of 1163 then your portfolio valuation would increase from £1000 by buying at the current price of 171 to being worth £6801 if targets are met and achieved . Stop Loss A 40% drawdown and stop loss level is when the price is at 102. 4. EDOUSD EDO for me is the underdog, now that we had the extremely bullish year in 2017 and many people now begin to understand the concept of digital currency and assets, the large players above have already experienced media attention, whilst the upside positions are good for risk: reward. They are the more obvious choices for retail traders , the real value in this market is hedging a wild card , a winner before it is even discovered by mass media coverage and price speculation. This is my secret weapon. The prospects of this is a whopping 2100% + opportunity (X20 times initial stake) So assuming £1000 input , if we close out at 6.13 then your portfolio will be worth £21500. Stop Loss A 40% drawdown for EDO is set at the 0.16 range. Monthly/ Quarterly purchases to dollar cost average: Simply put, dollar-cost averaging refers to the practice of building investment positions by investing fixed dollar amounts at equal time intervals, as opposed to simply investing a lump sum all at one time. Additional notes: XRPUSD isn’t available on coinbase to buy as of yet, so to purchase this you can find shares on kraken.com
Hi, This guide comes at a very good timing for you due to our long term perspective on how a number of forex and crypto currency markets will perform in a simplified manner over the course of the next 5 years. Digital currency trading is heavily lucrative if executed with strategy, solid psychology and the correct attitude to respecting risk & reward. As someone who is new to this, there are going to be psychological events where you may question the decision to remain solidarity to your/our trading bias. Over time you will understand that time is the 5th element to trading so splitting your risk not only over different price points but over different financial and calendar quarters is a wise move to avoid being tied up with too much capital. Returning to the highs: In the next link I will discuss the options for this in more detail and how to capitalise, the markets move in waves and over the past 2 years the prices are returning to the lowest points. The fundamental rule of any investment wether property, stocks , etc is to buy low , sell high! So where most investors are fearful of taking risk, now is a perfect time for a fresh investor to take advantage because any upside should be smooth without resistance and draw down. Here are 3 pics of current crypto’s that are in my investment plan for 2020 and the targets I’m aiming for as they return to the previous highs. Bitcoin: current price 7964 - targeting 20,000. XRP: current price 0.28 : Targeting 2.80 ETHEREUM- currently trading at 171. : targeting 1163 EDO : currently trading at 0.28 : Targeting 6.30 I will explain more on how to convert monetary goals with targets. Things to download and sign up to * Coinbase.com + app download * TradingView.com + app download * Jafx.com - sign up to this broker

We sent out this alert in the full member zone at 7:19am on the 14th November, price retraced to form a new higher high.
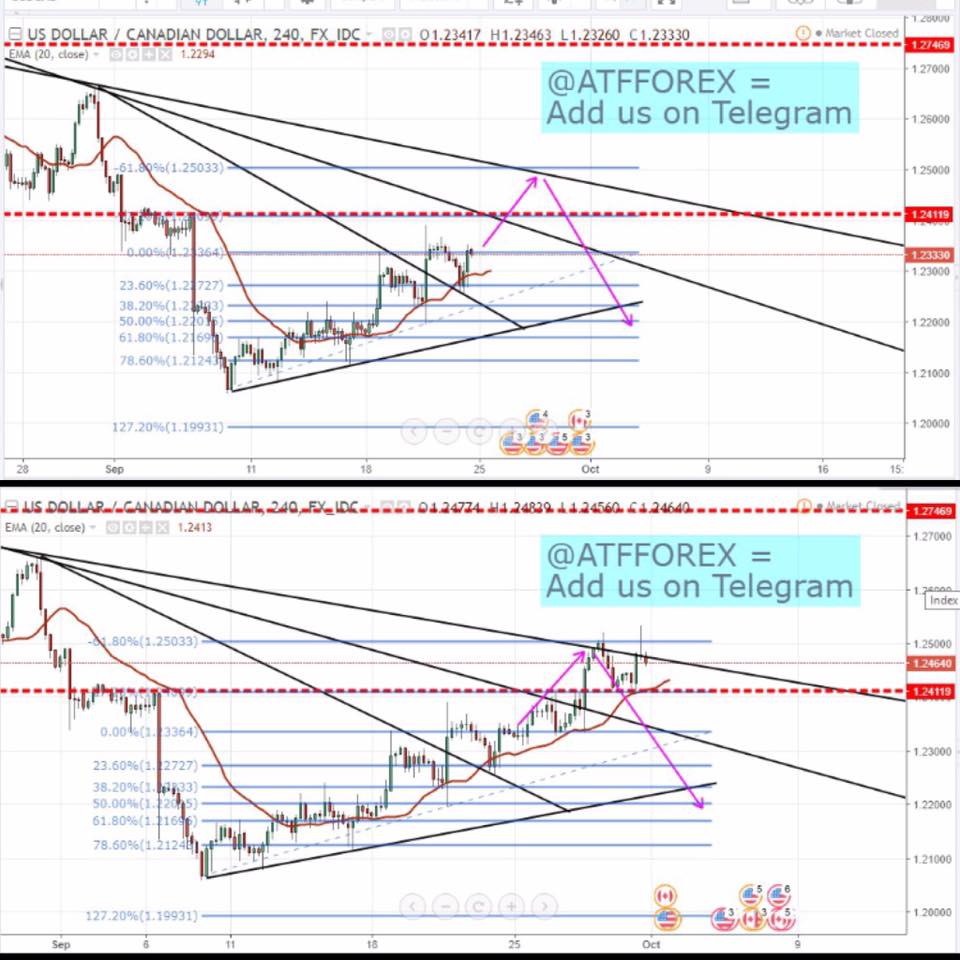
USDCAD ... Before and after 1.2500 rejected and retested, a Lower High appears to be forming. Short term shorts to 1.2410 key level. If price breaks 1.2400 then we see a Lower low @ 1.2000
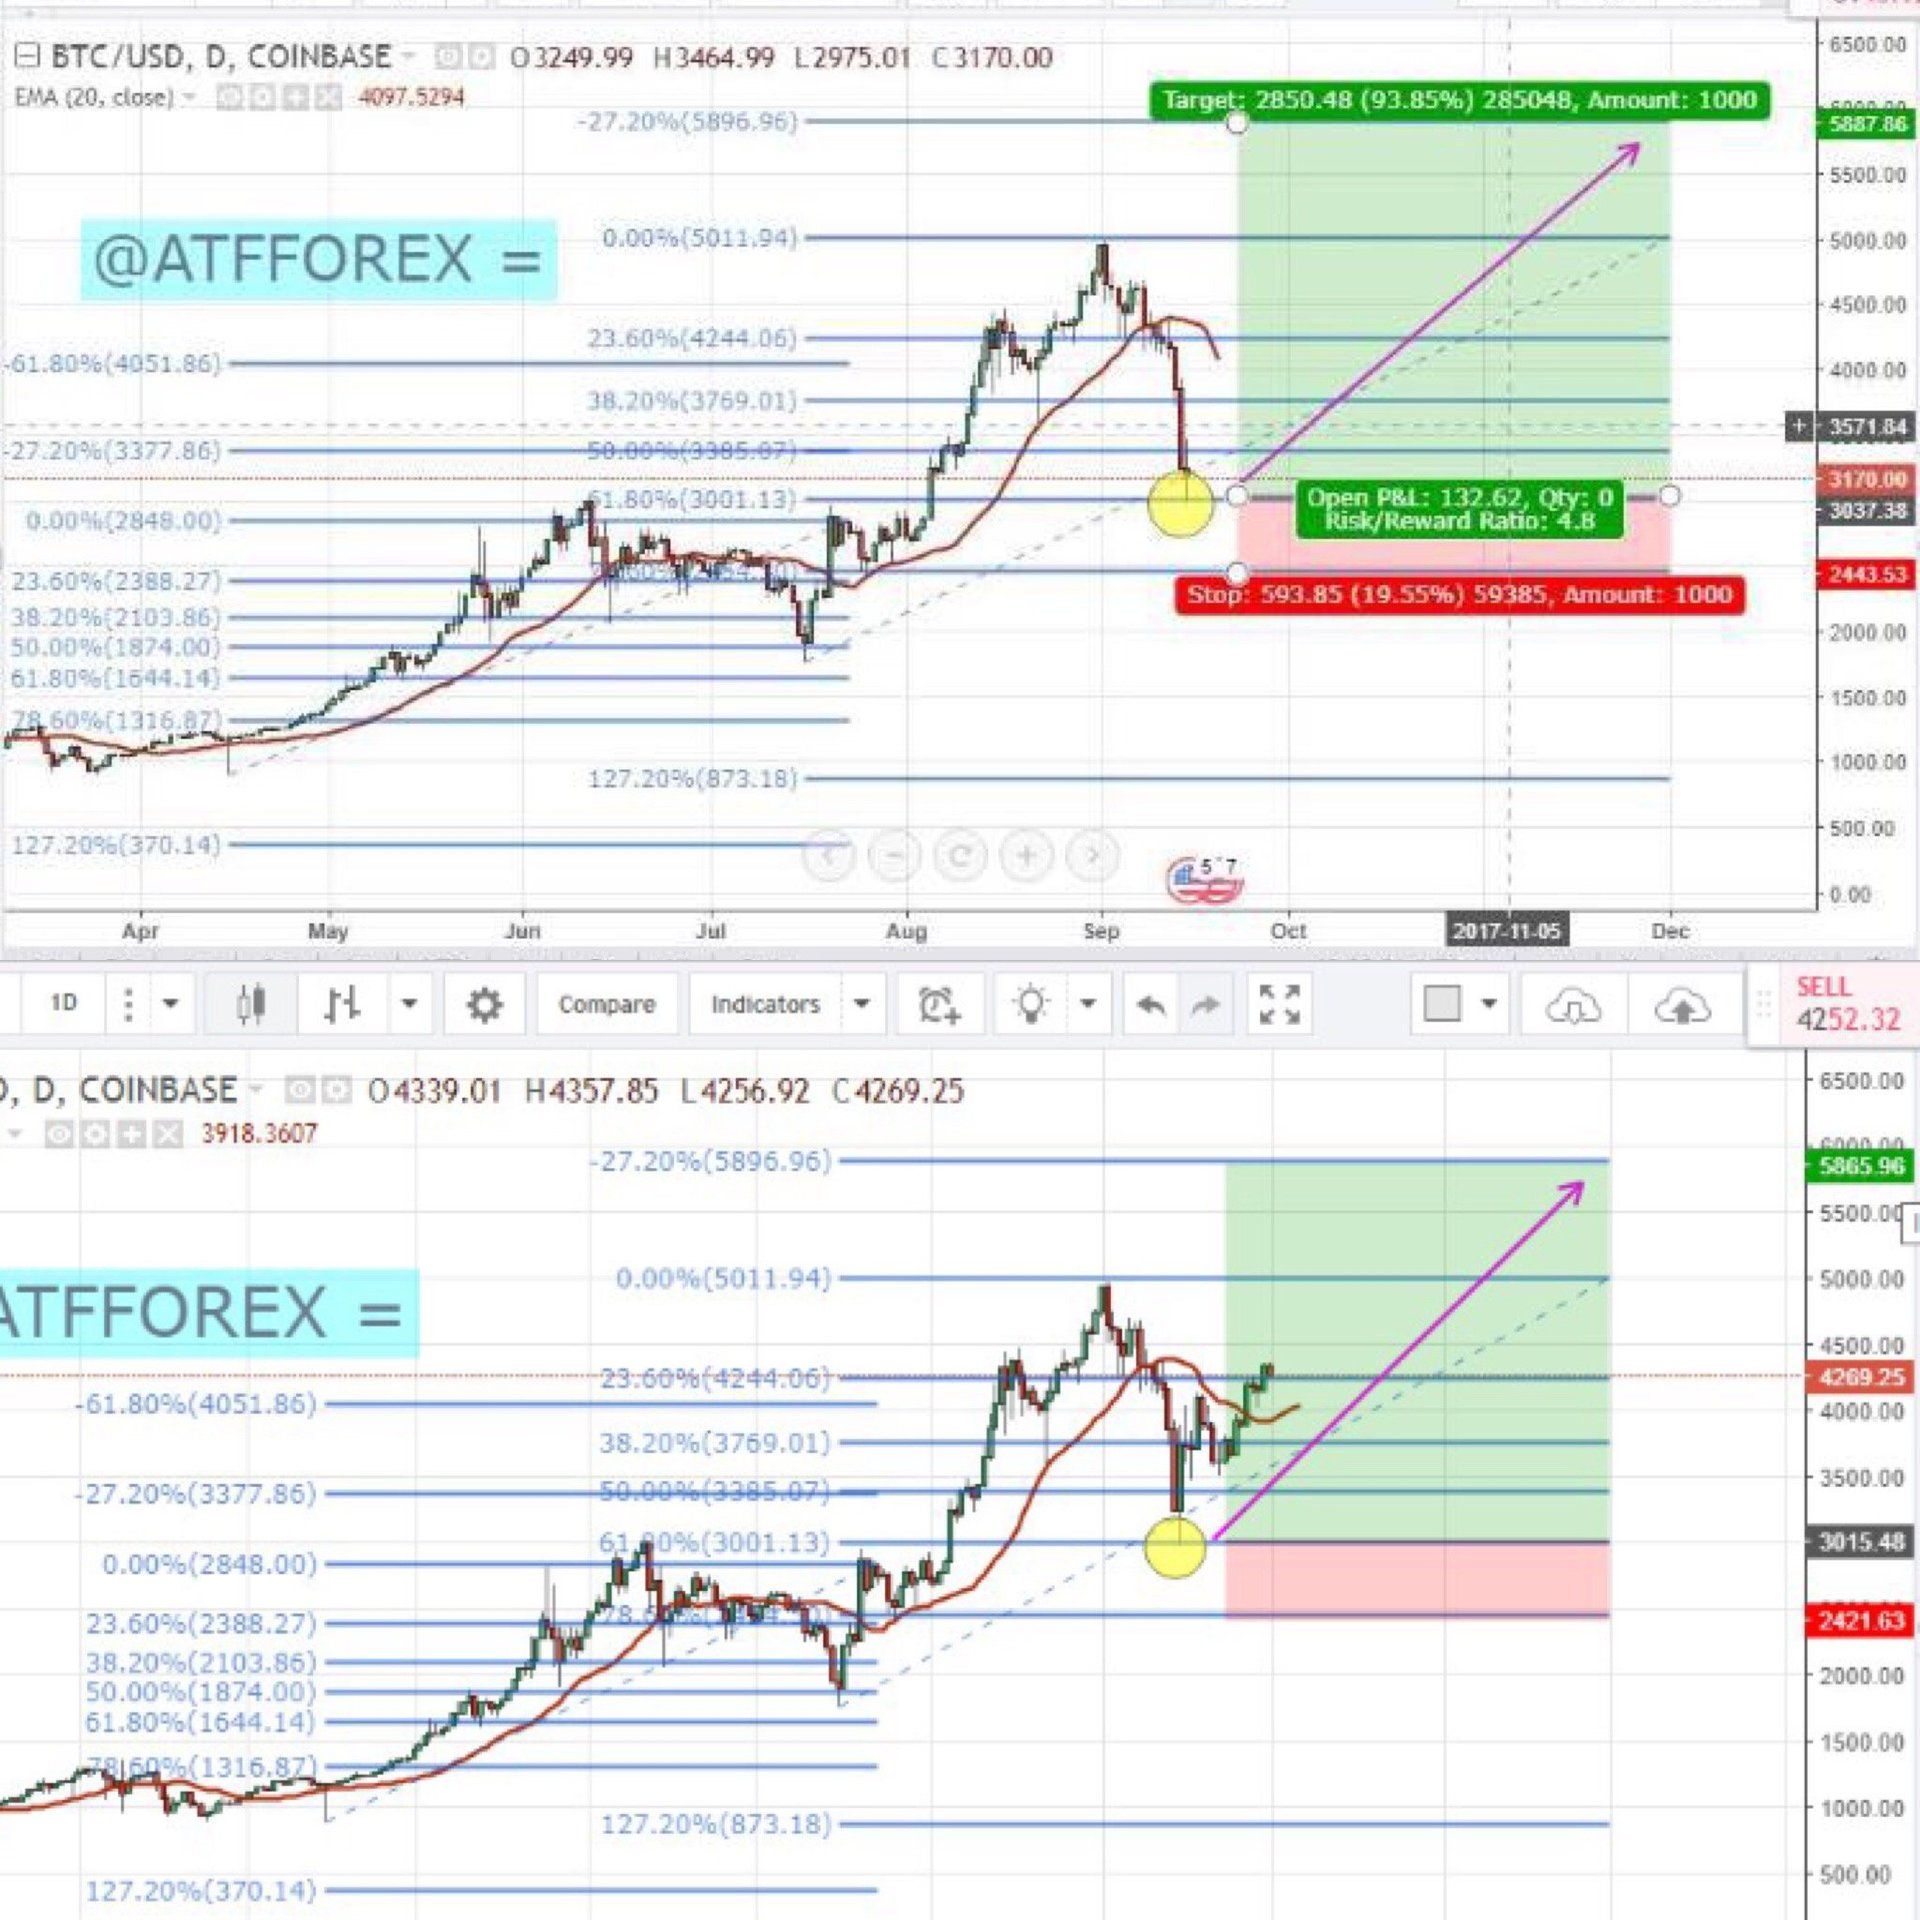
Price bounced aggressively at 3000 (61.8% fib) , 3600 is the new support.. when 4100 is broken then we are creeping up to target. More aggressive trades can be made with confidence assuming 3800 will be the new floor and we can compound up to target.

GBPUSD Short term & long term before and after ... expect a retest of 1.3075 key level (new support).. then BUYBUYBUY ... 2 trades .. T1 target 1.3250 and T2 1.3450

Copyright © All Rights Reserved.
RISK DISCLOSURE STATEMENT:
The services and content that Armchair Trading Floor provides is for educationa and research purposes only.
Risk Notice: Foreign Exchange and CFD trading carries a high degree of risk and is not be suitable for everyone. Trading is not guaranteed to make you money, only invest what you can afford to put at risk as there is a possibility you could incur losses.
THE USE OF LEVERAGE CAN LEAD TO LARGE LOSSES AS WELL AS RETURNS. PAST RESULTS ARE NOT INDICATIVE OF FUTURE RESULTS. PLEASE READ CAREFULLY THE FULL DISCLAIMER.